BUILT2LAST
BUILT2AFFORD – Big Data Enabled Energy-Efficiency and Health Assessments to Provide Affordable Housing
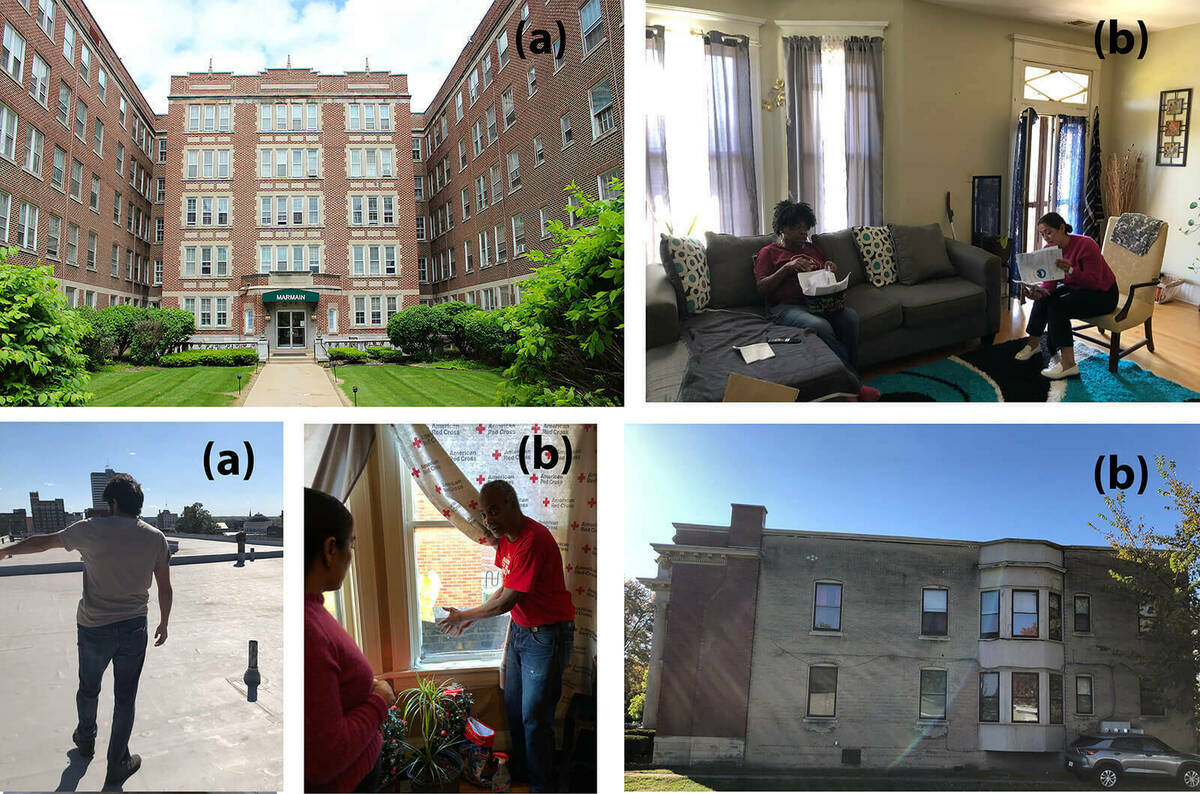
Our research objective is to co-develop, test, and validate BUILT2AFFORD—a framework and tool designed to preserve affordable housing through low-cost, energy-efficient retrofits. Utilizing Machine Learning and Google Street View Images, BUILT2AFFORD will pre-identify passive retrofit strategies, demonstrated through the retrofitting of eight testbeds to showcase its viability.
AI-Augmented Environmental Assessment for Sustainable Building Design
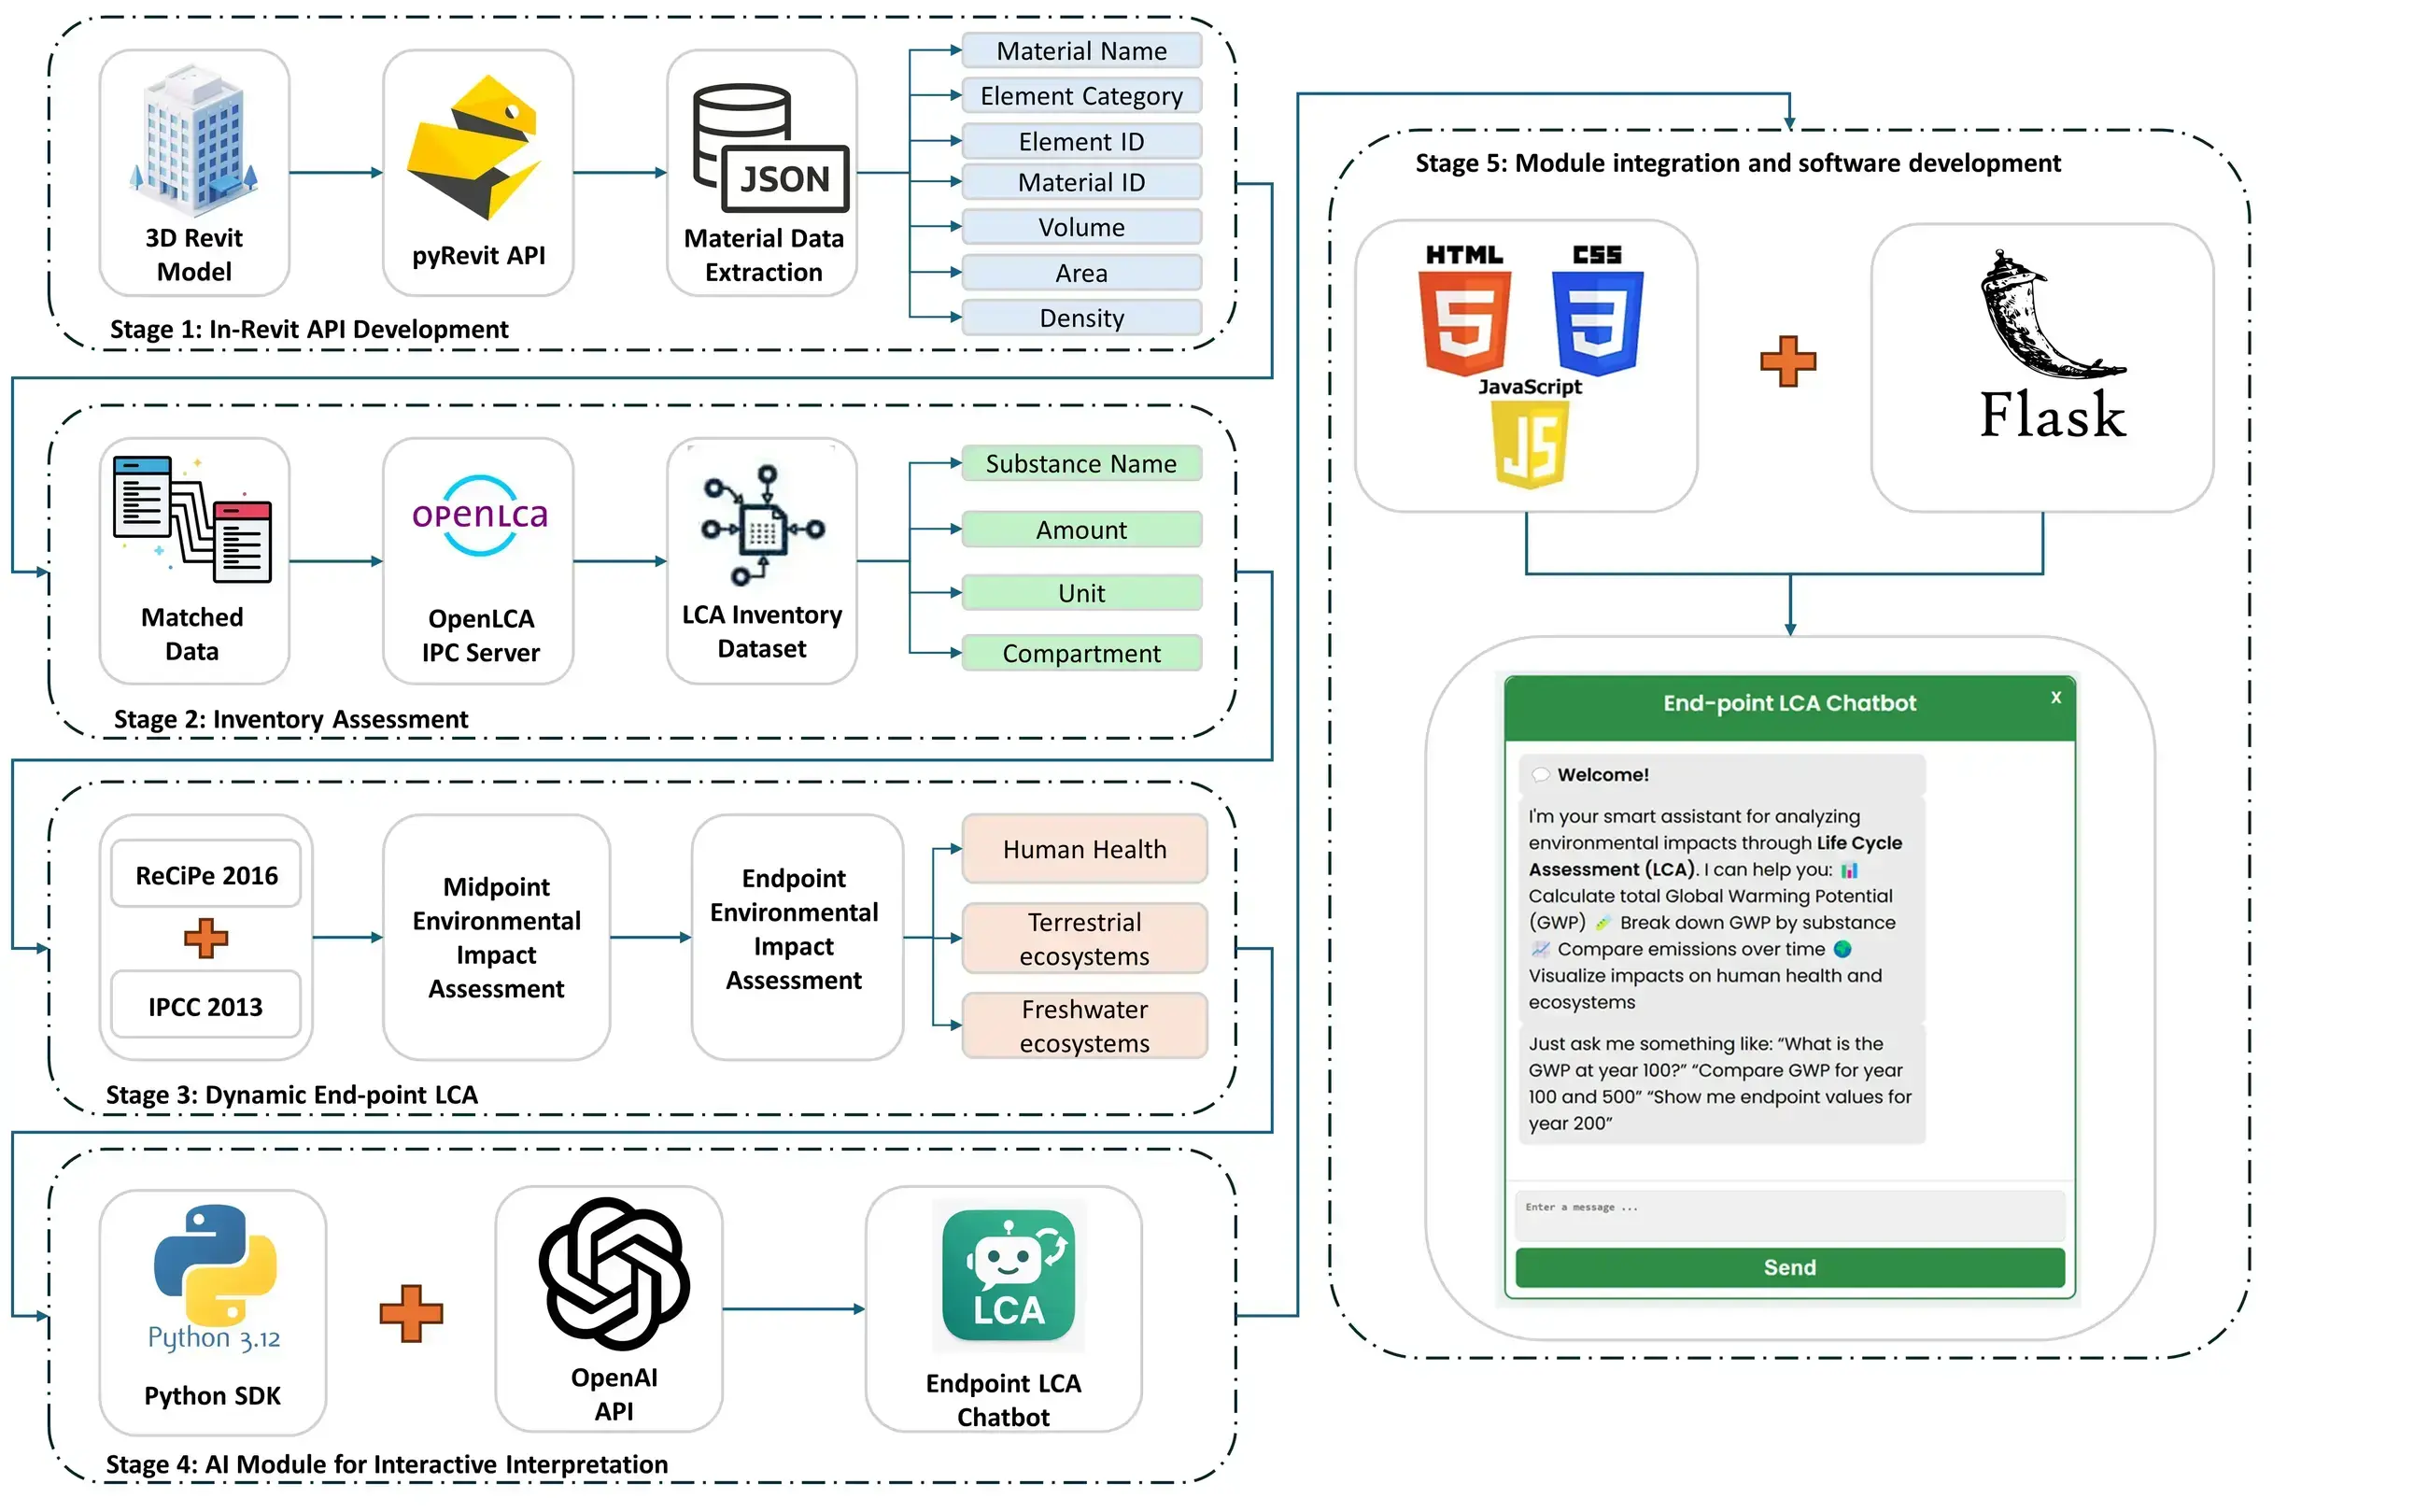
This research develops a methodological framework that integrates BIM, LCA, and artificial intelligence to support sustainable building design. The framework automatically extracts material data from Revit models, maps them to life cycle inventory processes in OpenLCA, and performs midpoint and endpoint environmental assessment across user-defined time horizons. An LLM-based chatbot is integrated to help users query results, compare scenarios, and receive plain-language interpretations, making environmental assessment more accessible during early design decision-making.
Machine Learning – Life Cycle Assessment – Environmental Product
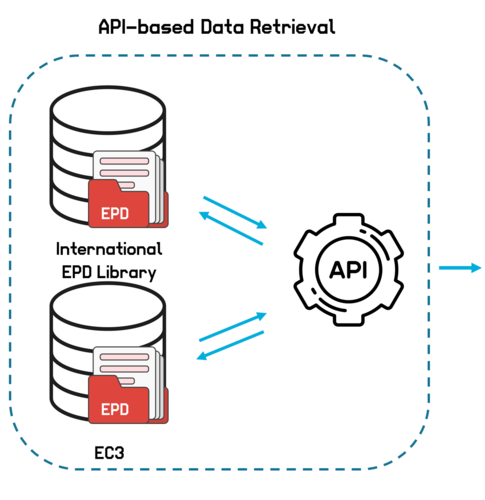
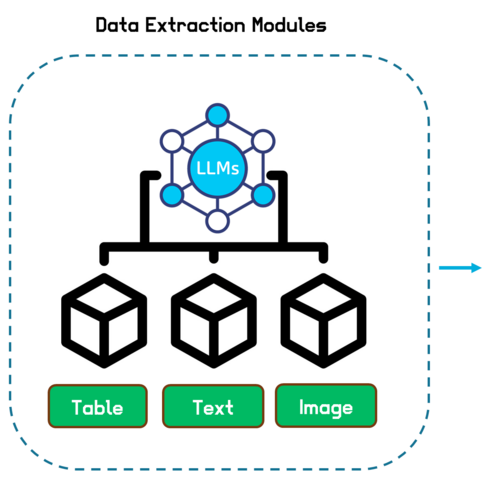
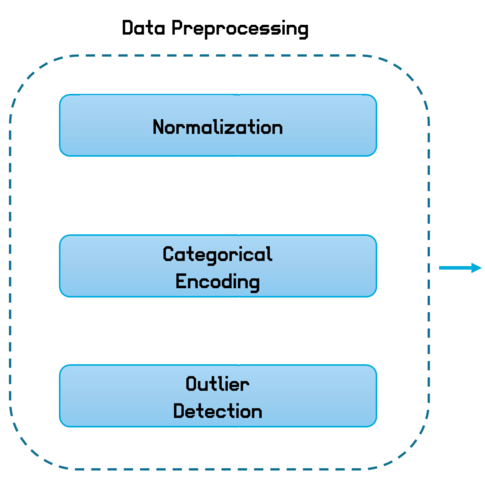
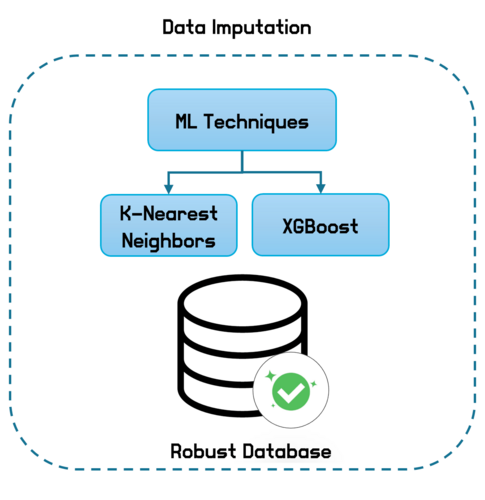
We developed an AI-powered system to evaluate the environmental impact of construction materials by analyzing thousands of Environmental Product Declarations (EPDs). Our approach automates data collection, fills in missing information, and helps make sustainability assessments faster and more reliable. This work supports smarter material choices and promotes a more sustainable construction industry.